Signals Backtest
Backtesting helps you evaluate how your strategy would have performed in the past using historical market data. You can create an indicator-based signal strategy and backtest it by adding a simple 920 strategy.
By running a backtest, you can analyse strategy stats performance such as overall profit, number of trades, win rate, average profit/loss, drawdown, risk-reward ratio, and streaks. These insights help you understand strategy behaviour, validate performance, and refine your strategy before moving to forward testing or live execution.
Let’s connect the 920 Time-Based Strategy to an Indicator Signal-Based Strategy to view and analyze the backtest performance.
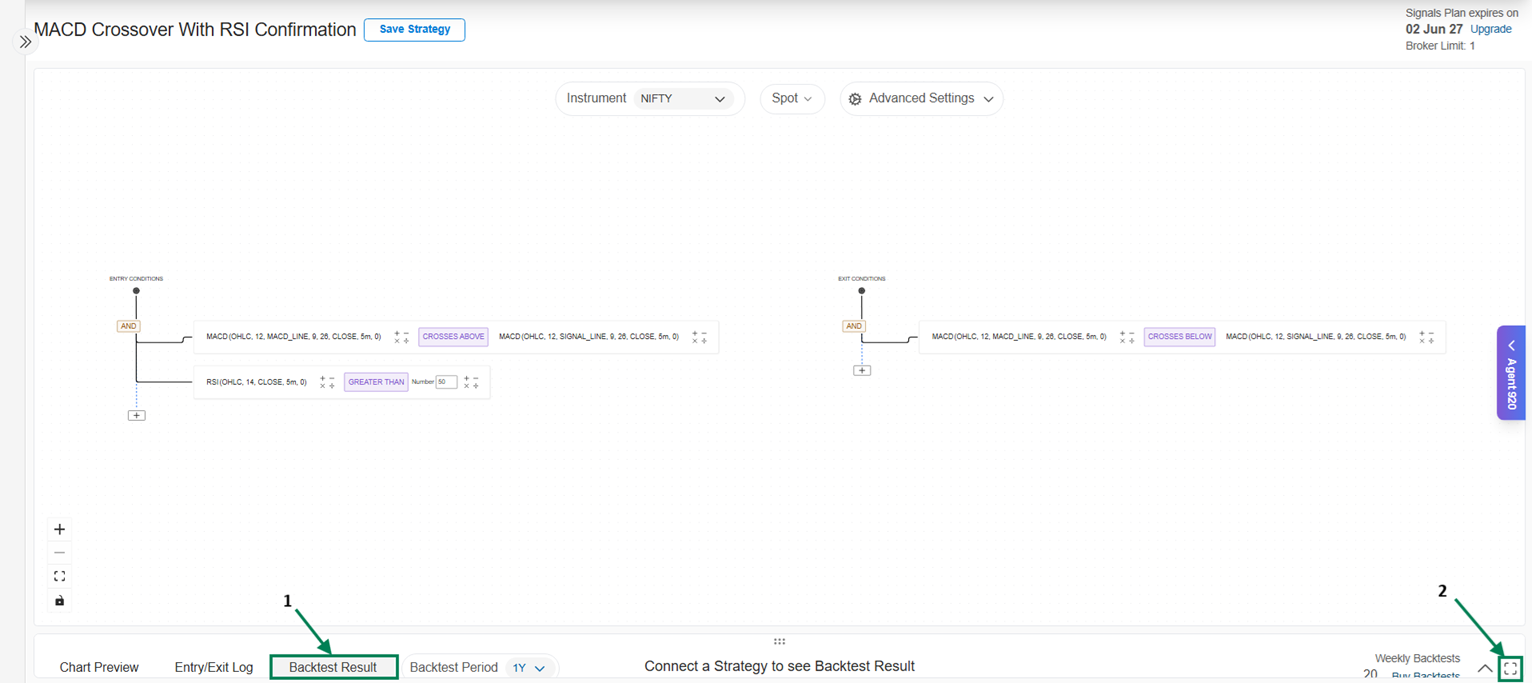
- Click on BackTest Result
Use Maximize to view the full screen
** 3.** Click on Connect Now, then you can either create a new strategy or use an existing strategy saved in your AlgoTest account.
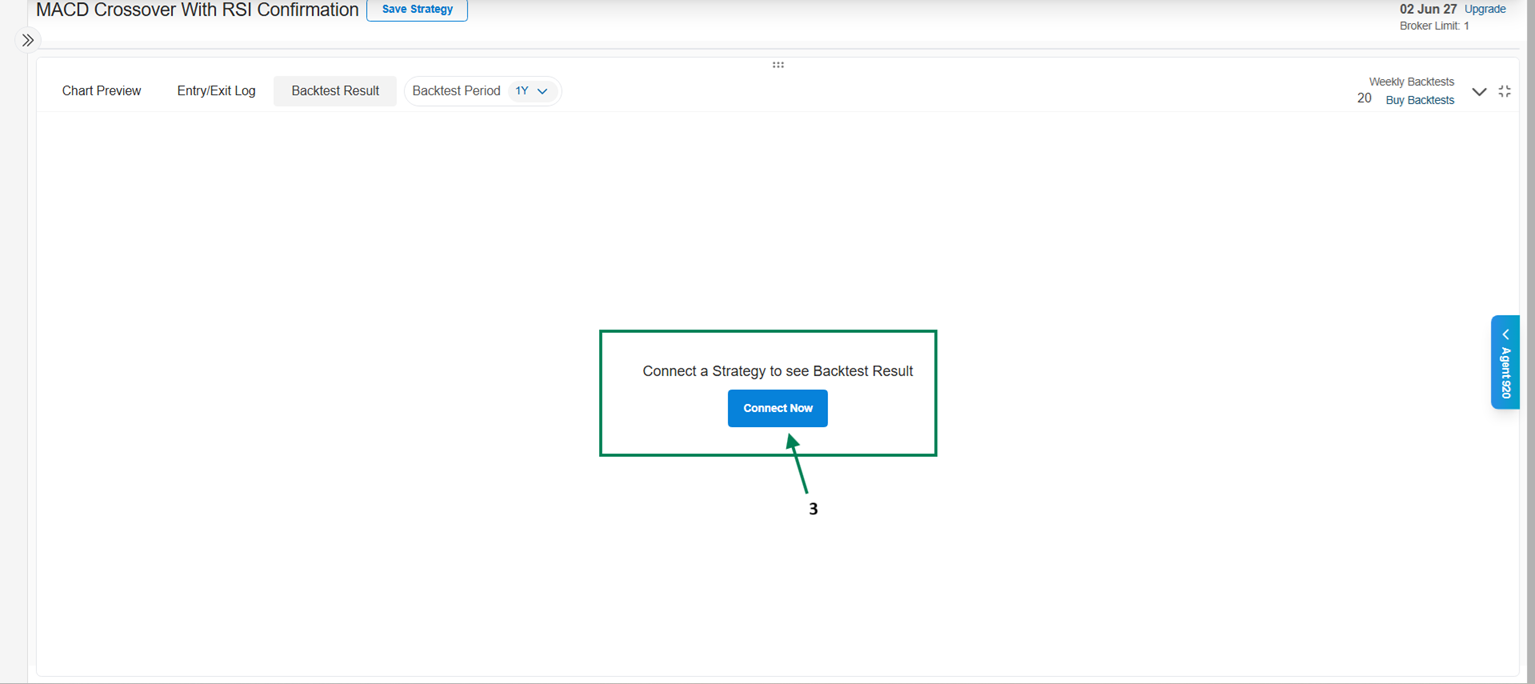
** 4.** After clicking on Connect Now, you can either click on Create Strategy or use an existing strategy, as shown in the image below.
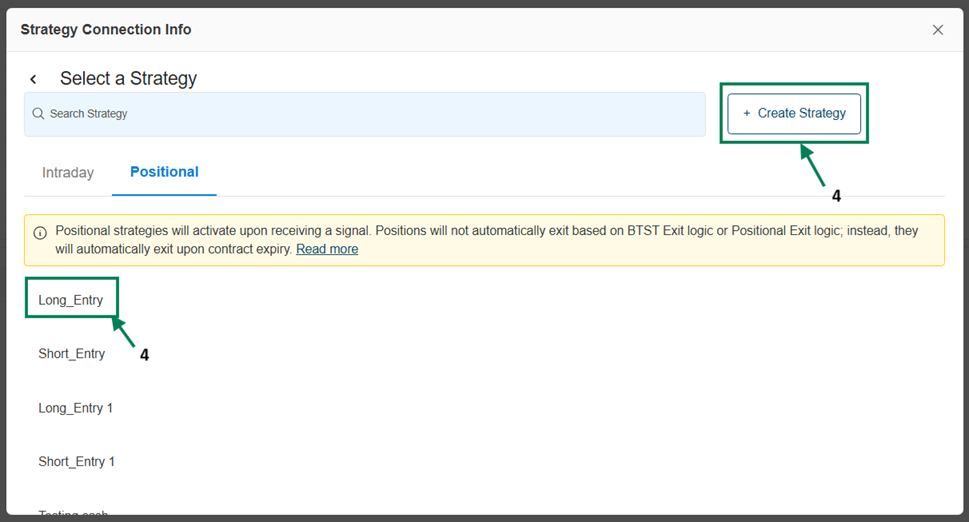
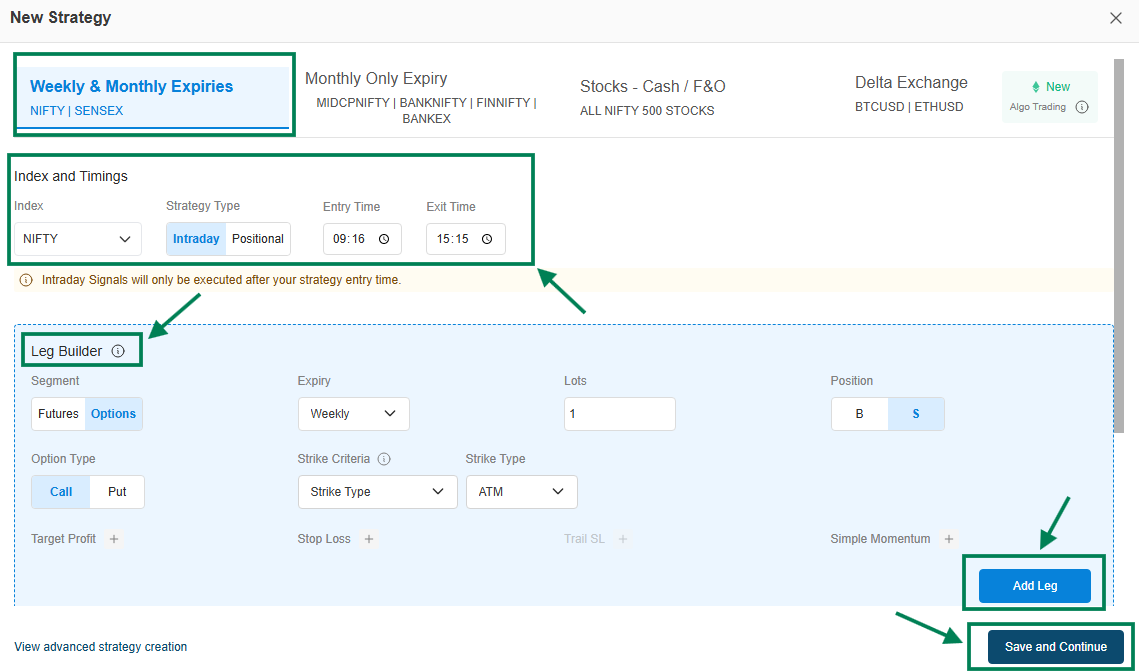
5. Let’s build a strategy by clicking on Create Strategy. The Strategy Builder window will appear.
-
Under Index and Timings, select the Index, choose the Strategy Type (Intraday/Positional), and set the Entry Time and Exit Time.
-
In the Leg Builder, configure details such as Segment, Expiry, Lots, Position, Option Type, Strike Criteria, and Strike Type.
-
Once you configure and click on Add Leg, the Strategy Legs will appear below.
-
You can also add optional settings like Target Profit, Stop Loss, or Simple Momentum.
-
You can use the Overall Strategy Settings for better risk management in your strategy, if required (such as Overall SL, Overall Target, Lock Profit, and Trail Stop Loss to Entry Price).
-
You can View advanced strategy creation for more advanced features if required.
Finally, click on Save and Continue to proceed.
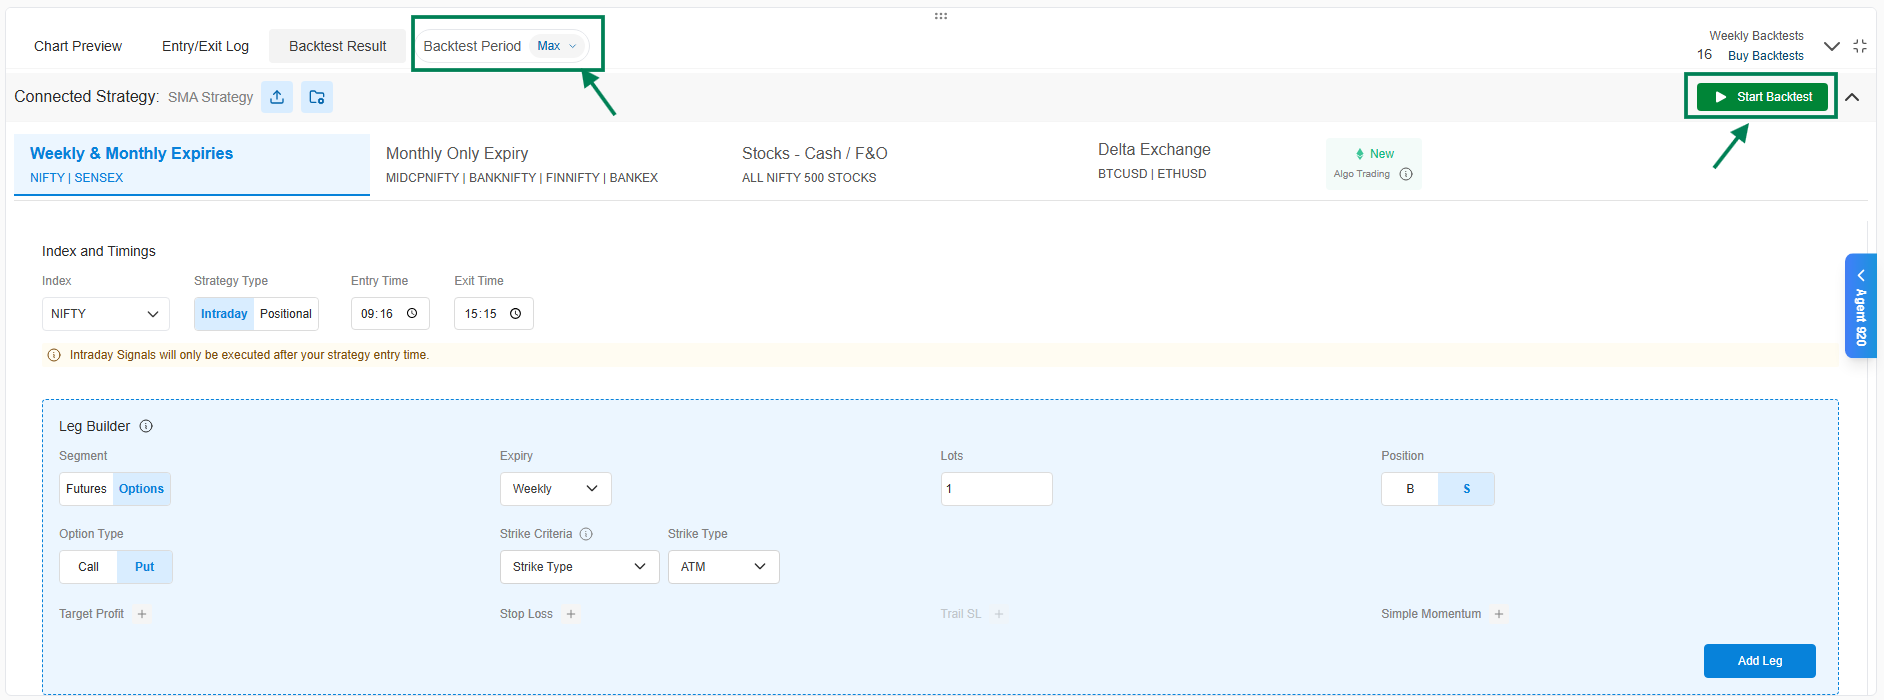
Select the Back Test Period, then click on Signal BackTest, and you can view the backtest results.
BackTest Results:
After clicking on Backtest Results, here you go - analyze the strategy performance, explore detailed stats, and review Comprehensive Backtest Insights at a Glance, giving you clear, actionable insights to evaluate, optimize, and scale your trading strategy with confidence.
-
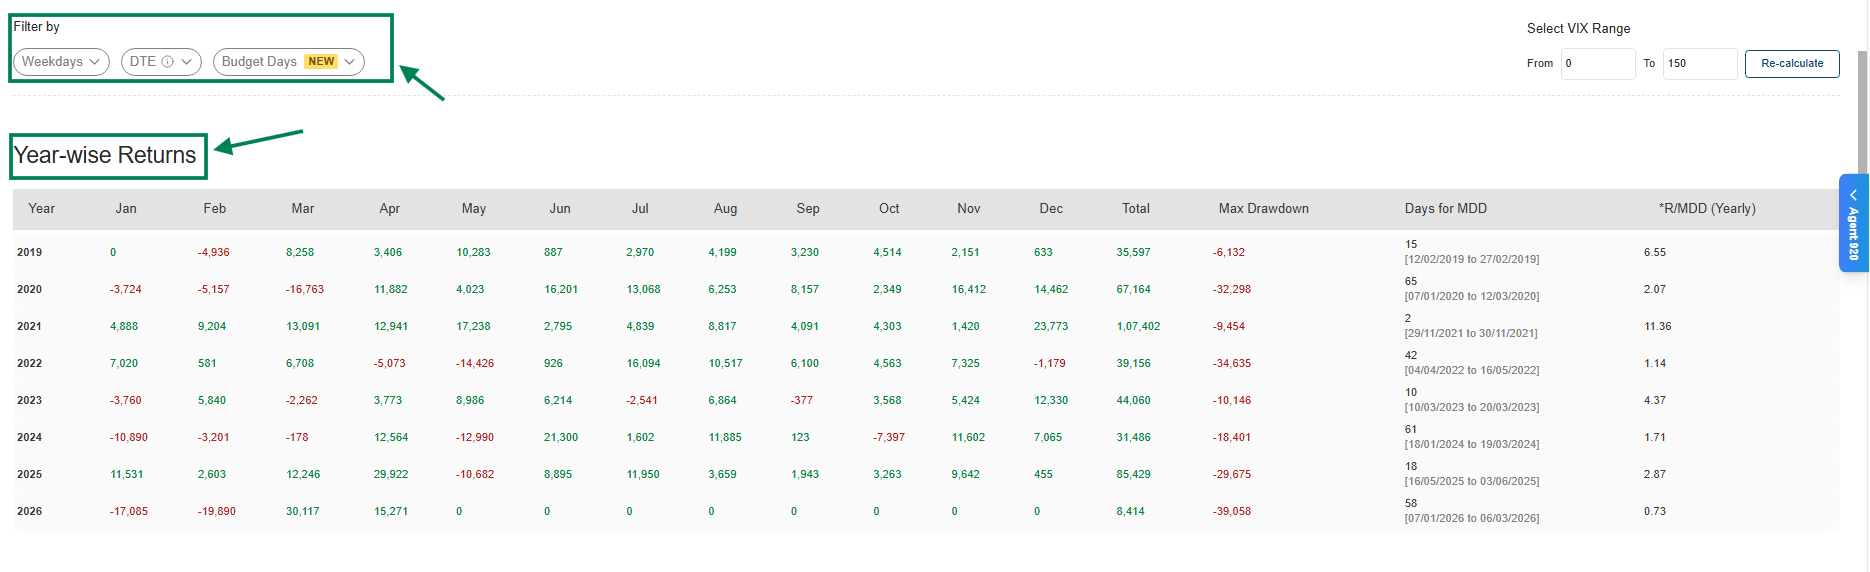
Year-wise Returns | Cumulative PnL & Max Drawdown | DTE / Weekend Filter Performance
-
Advanced Strategy Stats (P/L, Trades, Win Rate, RR, Drawdown, Streaks & more)
-
Smart Trade Logs (Day-wise CSV with sorting by PnL or day)
Year-wise Returns – View performance across each year to understand consistency, identify strong and weak periods, and evaluate how the strategy adapts to different market conditions.
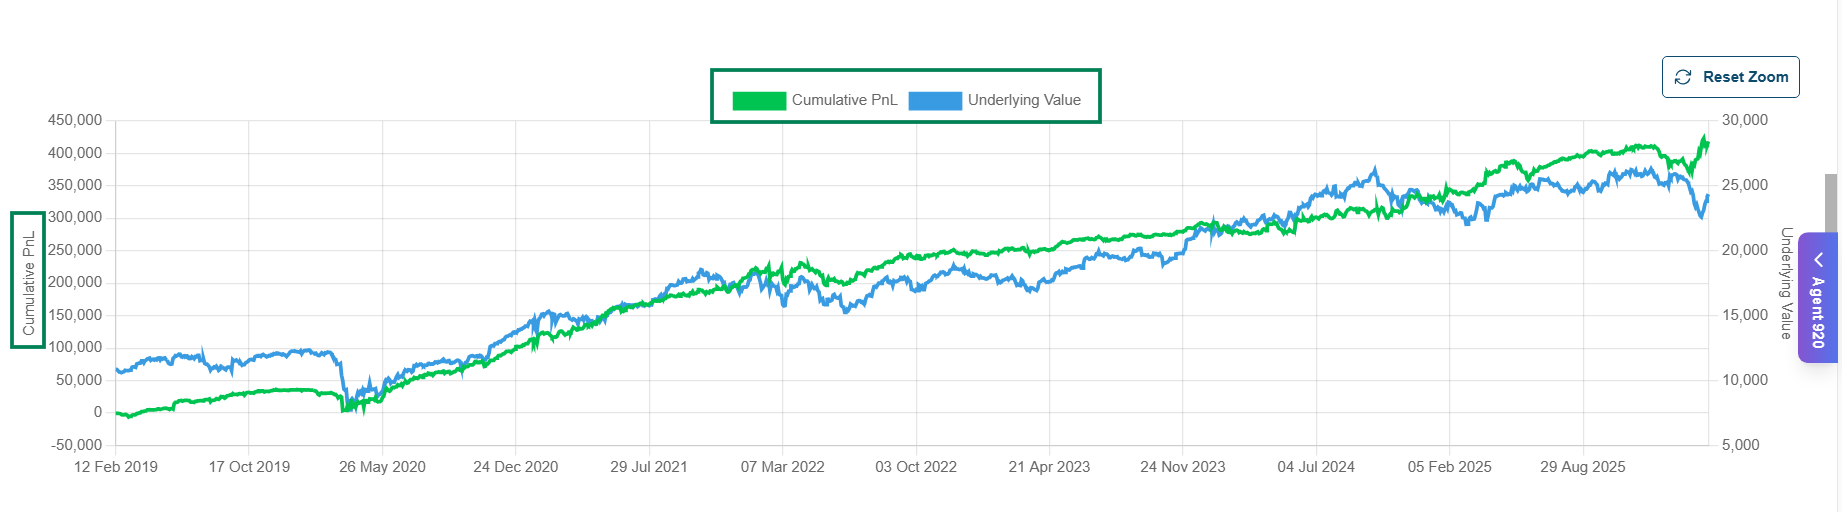
Cumulative PnL: Cumulative PnL vs Underlying Value Curve – Compares your strategy’s overall profit with the underlying asset’s price movement, helping you clearly view how the strategy performs relative to the market trend.
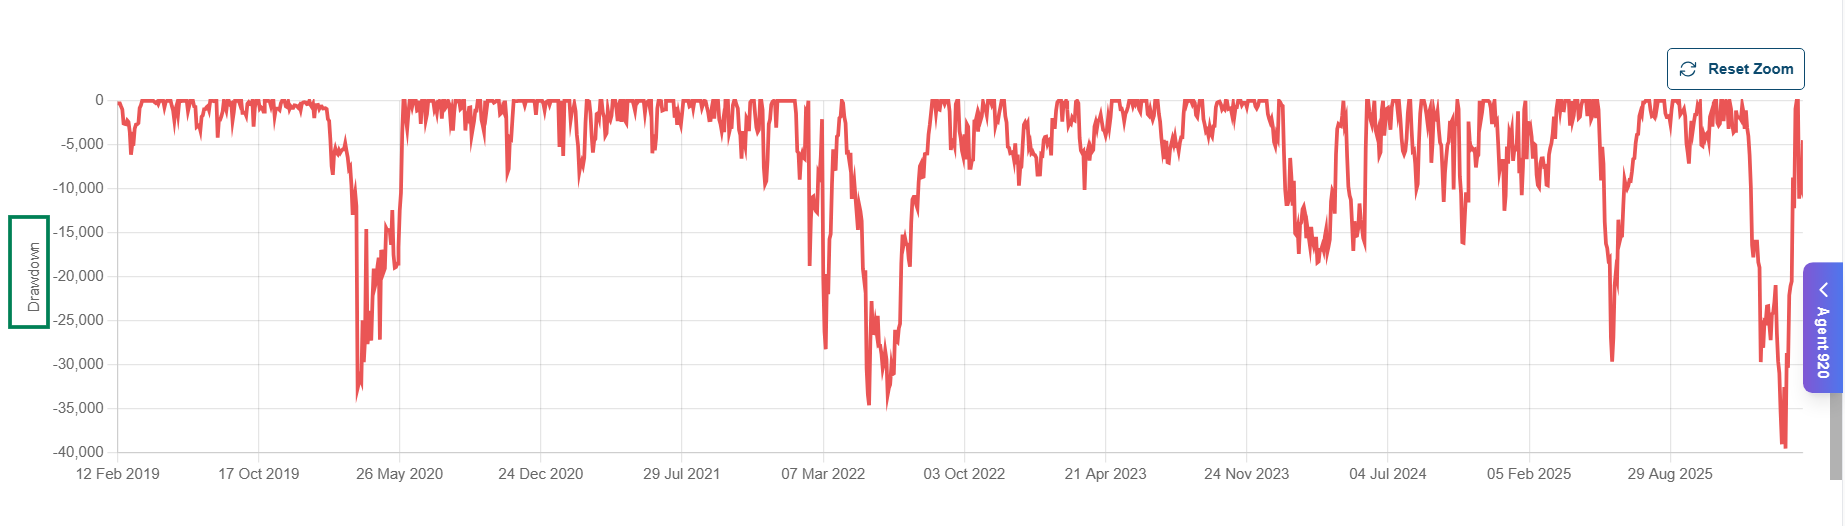
** Max Drawdown :** Measures the largest peak-to-trough decline in performance, showing the worst drop your strategy experienced before recovering. This helps you clearly view the maximum risk and downside during the backtest period, and even lets you deep dive further with Monte Carlo Analysis.
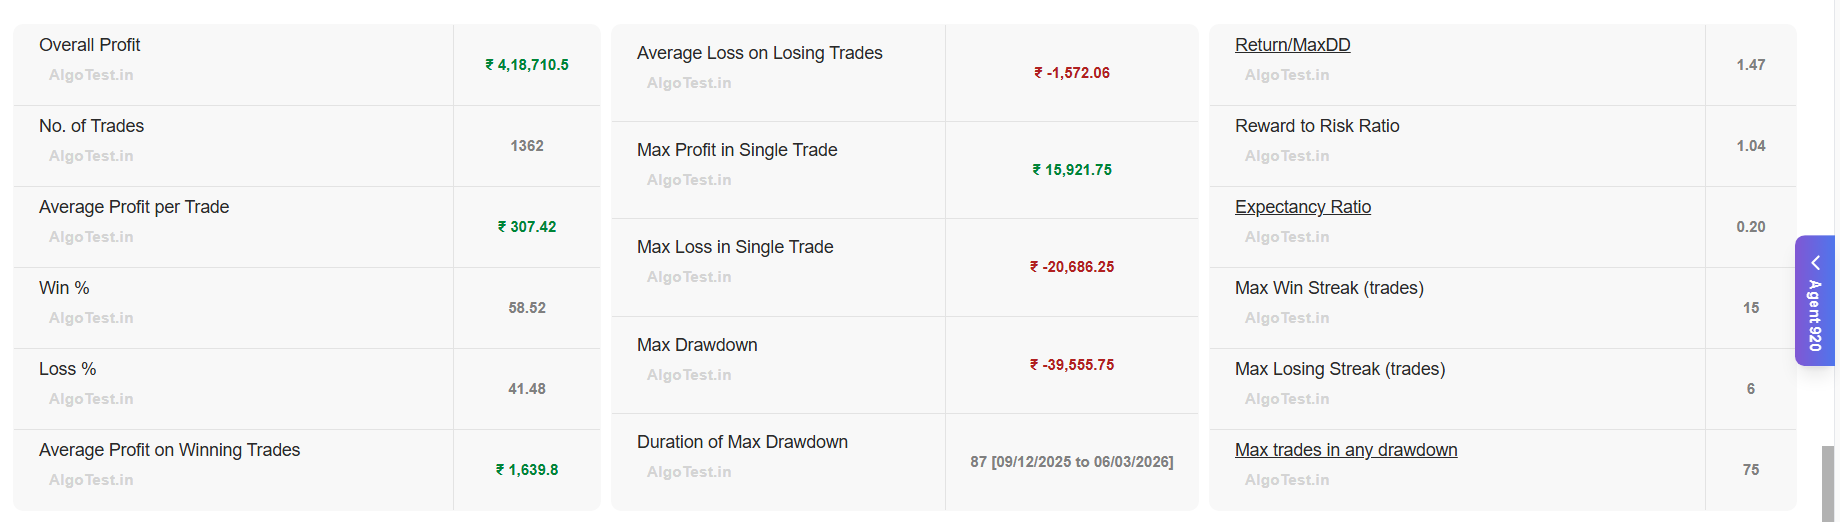
Strategy Stats Performance: This section shows the overall performance of your strategy based on the backtest results. It includes key metrics such as total profit/loss, number of trades, win rate, average profit/loss, drawdown, risk-reward ratio, and winning/losing streaks, helping you evaluate and improve your strategy effectively.
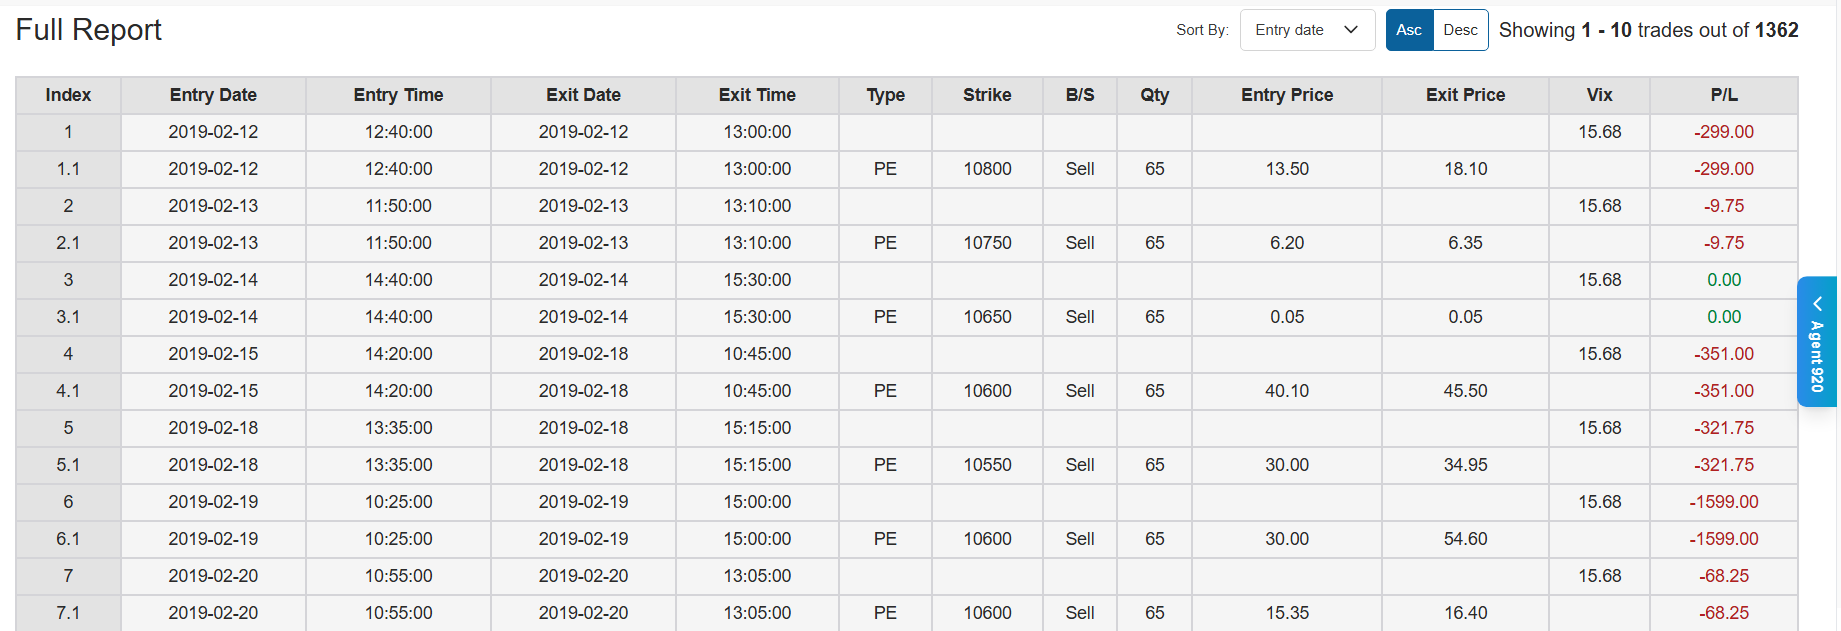
** Full Report:** Day-wise strategy Logs (Downloadable CSV File)
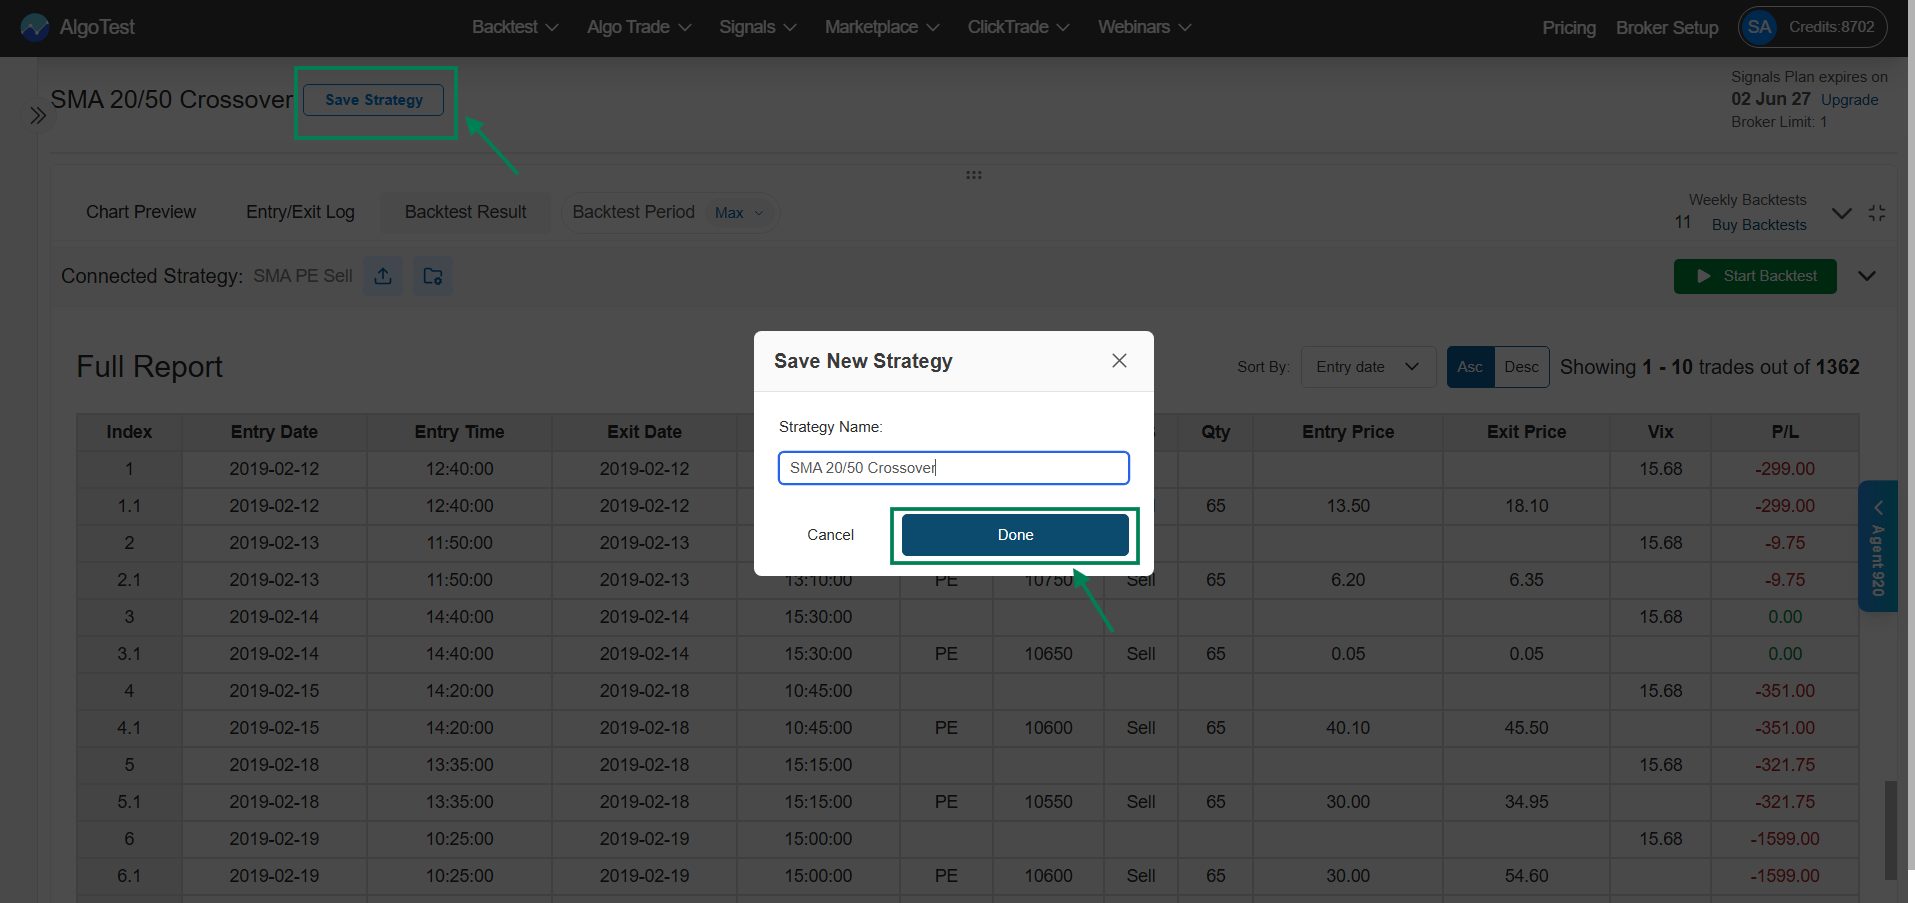
After reviewing all the details, fine-tune the strategy if needed or/, if everything looks solid, simply click Save Strategy, give it a name, and save it.